The United States is still short an estimated 4 million homes, and closing that gap through new residential construction remains critical to keeping homeownership within reach for American families. The Realtor.com Let America Build campaign continues to spotlight the barriers standing in the way of affordable housing and to push for solutions that make it easier to build. That work has incorporated policy and accountability by tracking which states are leading the way on affordability and homebuilding. For a second year, we bring that focus to the homebuyer directly with our guide to the top metro areas for purchasing a newly built home.
The 2026 Top New-Construction Metros report ranks the 10 markets that offer the best mix of availability, affordability, sustainability, and desirability among new homes. Drawing from the 100 largest U.S. metros, we score and rank each market using the following weighted criteria:
- New-construction share of listings, 33%
- New-construction premium (the percentage difference between median new-build and median existing-home listing prices), 33%
- Climate risk difference (the percentage difference in average flood, fire, air quality, wind, and heat risk between new builds and existing homes), 17%
- Hotness of new-construction market (based on page views per listing and median time on market for new builds), 17%
Each of the 10 metros below delivers a strong balance of what today’s new-home buyers are looking for, making any of them a smart place to start a search. These are the top metros for new construction in 2026.
Familiar Faces and More College Towns
Half of this year’s top ten were in the top ten metros for new construction in 2025 and three more were honorable mentions last year, showing the staying power of the best performing metros. College towns continue to be well-represented in the top ten this year. Nearly every metro on this list has a major research university or flagship school woven directly into its economy and identity, not just as an employer but as a talent pipeline, R&D engine, and cultural magnet. These metros are young, vibrant, and growing.
Carolinas Carry a Majority of the Top Ten
Six of the top ten metros for new construction in 2026 are in North or South Carolina. This strong Southeastern skew is not completely new, as the two states were home to three of the top ten metros last year, but this year’s highly-concentrated set of featured markets goes to show that new construction haves and have-nots are primarily determined by local building conditions. In the South, land is more readily available and less costly than in other regions, plus more permissive zoning and less restrictive building codes tend to make construction in the South more builder-friendly. Two more of the top ten metros are in Tennessee, making the South’s total a commanding eight out of ten. There is just one Western and one Midwestern metro on the list, and none from the Northeast. We know that in terms of the volume of new construction, the South leads the way, but this analysis proves that Southern metros also perform well in terms of pricing, sustainability, and new construction demand.
Small-to-Mid-Size Metros Continue Their Success
The largest metropolitan area featured in the top ten is Charlotte, the 20th largest metro in the country. Next-largest is Nashville, the 35th largest. Apart from these two, none of the top ten metros for new construction rank inside the 50 largest metropolitan areas of the country. Instead, these smaller cities and their surrounding areas show signs of rapid growth and the high levels of new construction activity that go along with it.
Ranking Criteria by Metro
| # | Metro | New Construction Share of Listings | New Construction Premium | Climate Risk Score vs Existing Homes | Page Views per Listing vs National Average | New Construction Days on Market |
|---|---|---|---|---|---|---|
| 1 | Charleston-North Charleston, SC | 24.8% | -12.2% | -0.5% | -6.9% | 48 |
| 2 | Greenville-Anderson-Greer, SC | 33.4% | -1.6% | 3.1% | 8.3% | 60 |
| 3 | Boise City, ID | 53.4% | -4.5% | 6.1% | -21.6% | 61 |
| 4 | Charlotte-Concord-Gastonia, NC-SC | 29.5% | 4.7% | 0.3% | 1.5% | 65 |
| 5 | Nashville-Davidson–Murfreesboro–Franklin, TN | 30.1% | 5.1% | 2.7% | -19.1% | 52 |
| 6 | Chattanooga, TN-GA | 26.8% | 10.1% | -2.4% | 20.1% | 66 |
| 7 | Winston-Salem, NC | 33.0% | 9.7% | 3.2% | 15.9% | 64 |
| 8 | Madison, WI | 30.8% | 12.5% | 0.8% | 108.4% | 70 |
| 9 | Durham-Chapel Hill, NC | 33.0% | 8.7% | -0.3% | -18.8% | 68 |
| 10 | Columbia, SC | 25.5% | -3.0% | 7.2% | -0.4% | 45 |
Metro Spotlights (scores out of 100.0)
Charleston-North Charleston, SC
Inventory Score: 71.7
Price Score: 99.0
Sustainability Score: 80.8
Hotness Score: 85.9
Total Score: 84.7
Our top new construction metro for 2026 is Charleston, SC. This burgeoning Southern market is home to a diverse employment base that includes defense jobs, aerospace and automotive manufacturing, and a bustling port. The metro’s strong middle class means consistent demand for affordable homes, and builders in Charleston have delivered ample new builds that are competitively priced–see the top marks for new construction premium. Though existing homes in Charleston are priced well above the national median at $504,832, the median newly built home is significantly more affordable at $443,273, a 12.2% discount (the best among our top ten metros).
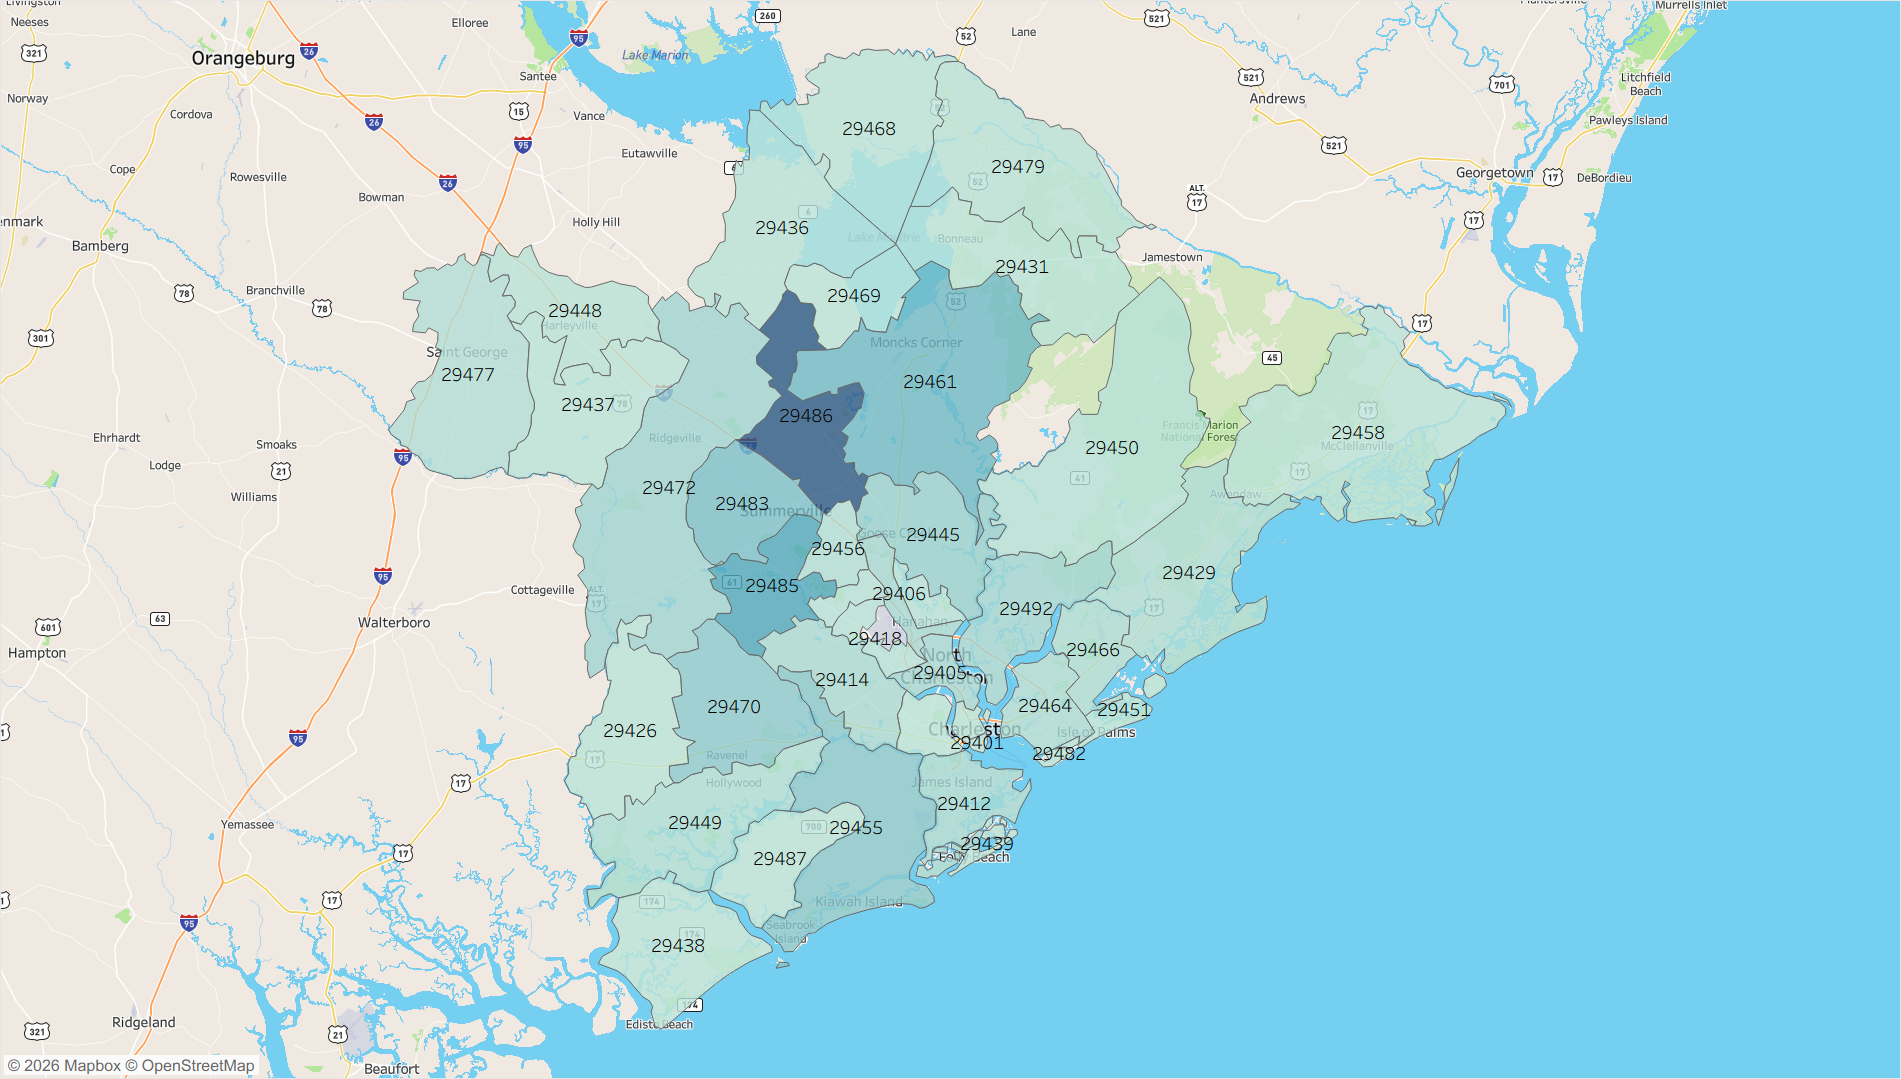
The hot spot for new construction in the Charleston metro is zip code 29486 in Summerville, a fast-growing suburb to the city’s northwest that contains the highest share of the metro’s new builds. New construction also thrives in the suburban ring to the west of Charleston. Our research has shown that suburban zips tend to contain more new construction listings at more competitive prices, and Charleston is a prime example of that. The only scoring metric where Charleston did not score in the top 20% of metros is on new construction share of listings, suggesting that there may be opportunities for even more new construction activity to take place there.
Greenville-Anderson-Greer, SC
Inventory Score: 92.9
Price Score: 92.9
Sustainability Score: 57.6
Hotness Score: 78.8
Total Score: 84.5
Second place in our rankings is another South Carolina metro located on the opposite side of the state, Greenville. Greenville scored in the top 10% of metros for the two most heavily weighted metrics, new construction inventory and new construction pricing, which launched it into its highly-ranked position. Greenville is a manufacturing and logistics powerhouse, and with those high-quality jobs come population growth and demand for homes. One of the major draws to Greenville is housing affordability, with the median existing home priced at $370,485 and the median new build even lower at $364,493.
Greenville has a fair amount of new construction activity taking place near the city proper, but even more in the suburbs to the south. Zips 29673 (Piedmont) and 29644 (Fountain Inn) contain the highest shares of new builds in the metro area, offering the opportunity for a low total cost of ownership to those searching for homes there. Greenville’s weakest score in our ranking metrics comes for sustainability, as the new builds in the metro tend to have higher risk of wildfire and flood than the existing homes for sale.
Boise City, ID
Inventory Score: 100.0
Price Score: 96.0
Sustainability Score: 39.4
Hotness Score: 56.6
Total Score: 81.0
The lone Western metro in our top ten, Boise, ID comes in at number three. Though not as quickly as it was during the pandemic, the Boise metro is growing, and it boasts the highest share of for-sale listings that are new builds in our rankings at 53.4%. High-tech fabrication is a major employment segment in Boise, bringing many workers to the metro. With new homes priced below existing ones ($559,102 vs $585,353), builders in Boise are giving these buyers attractive and attainable options.
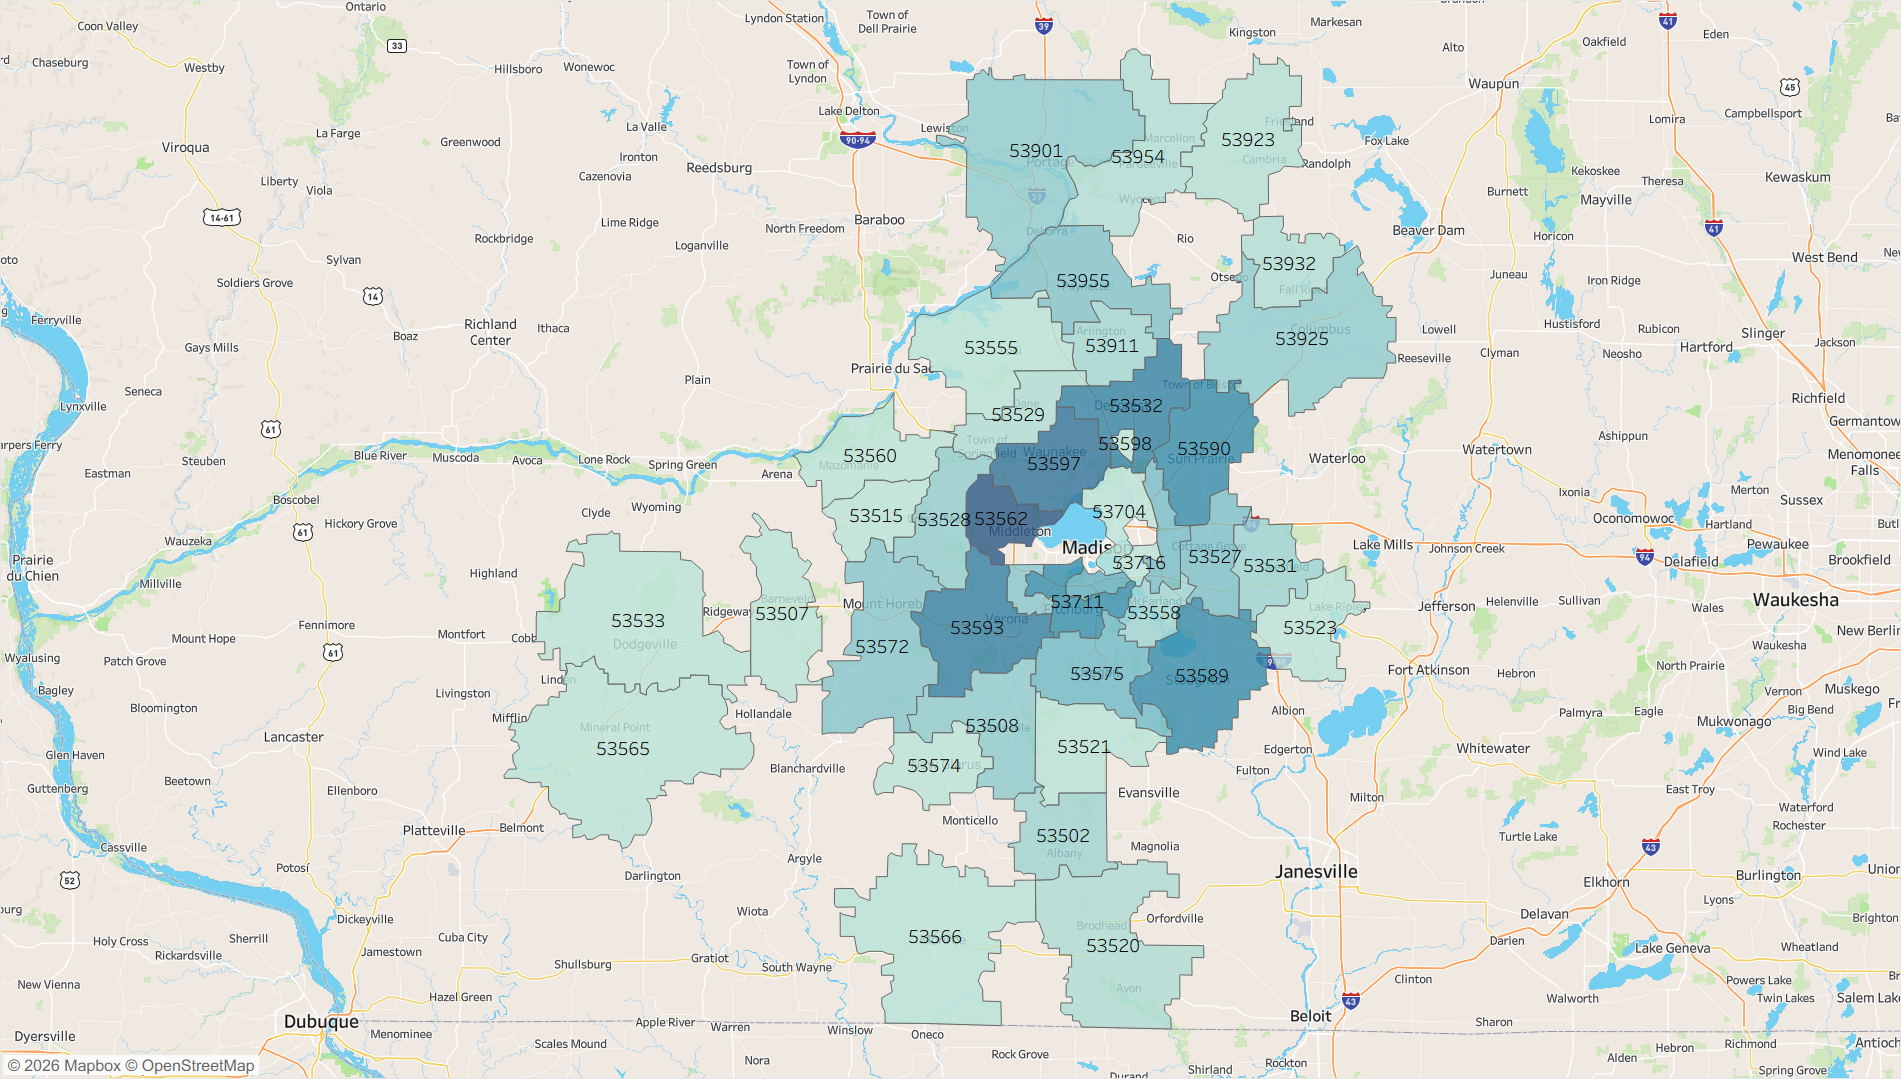
The new builds in Boise are concentrated in the western suburbs, places like Meridian (83646 and 83642), Nampa (83687), Eagle (83616), and Kuna (83634). Though these locations allow for lower listing prices on new builds, they tend to present higher climate risks than the locations of existing homes, especially related to wildfires. Along with a mid-pack hotness score, this keeps Boise from taking one of the top two spots in the rankings.
Charlotte-Concord-Gastonia, NC-SC
Inventory Score: 82.8
Price Score: 80.8
Sustainability Score: 77.8
Hotness Score: 62.6
Total Score: 77.9
Charlotte, NC is the largest metro in our top ten and it claims the fourth spot with high marks in terms of new construction availability of listings and the relative price of those listings. New builds are priced only slightly higher than existing homes in Charlotte ($440,177 vs $420,383), and they make up about 30% of for-sale listings. Charlotte is a financial hub, and the new construction activity in the inner ring of suburbs allows new-home buyers the opportunity to live a short commute from the city center.
Some of the zips with the most new construction listings include 28078 (Huntersville), 29745 (York), and 29720 (Lancaster), but there is strong new construction activity in parts of Charlotte proper as well (such as 28206). Charlotte new builds offer a variety of choices for new-home buyers to live in different parts of the metropolitan area. The weakest score for the Charlotte metro, which generally got good marks across the board, was for hotness. New homes in Charlotte receive fewer page views per property and spend longer times on the market than their existing home competitors.
Nashville-Davidson–Murfreesboro–Franklin, TN
Inventory Score: 84.8
Price Score: 79.8
Sustainability Score: 59.6
Hotness Score: 72.7
Total Score: 76.8
Nashville is home to more than just country music, it has a thriving new construction industry that allows buyers the chance to search plentiful and well-priced new homes. 30% of the listings in the metro are newly built and they are priced just 5.1% higher than existing homes ($546,091 vs $519,675). Healthcare and the automotive industry also employ many residents of the Nashville metro, and this strong job market leads to plenty of demand for newly-built homes.
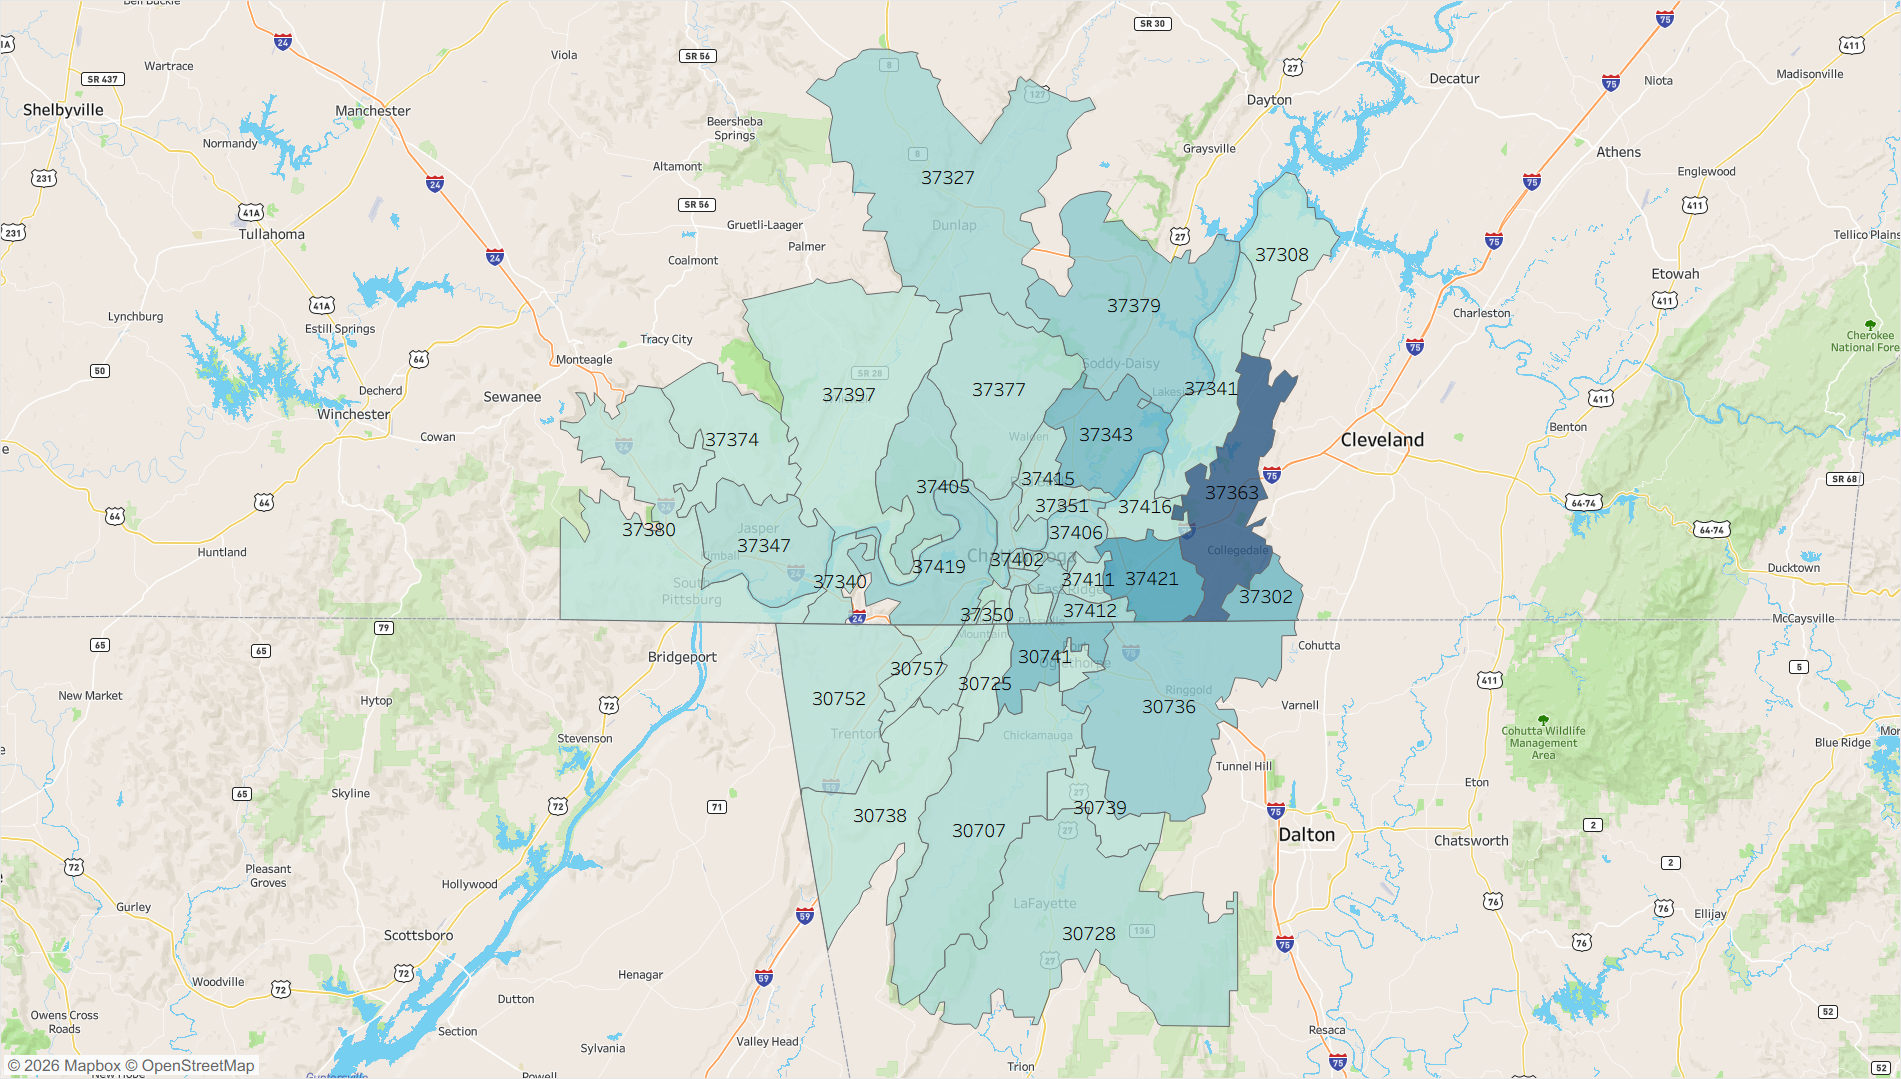
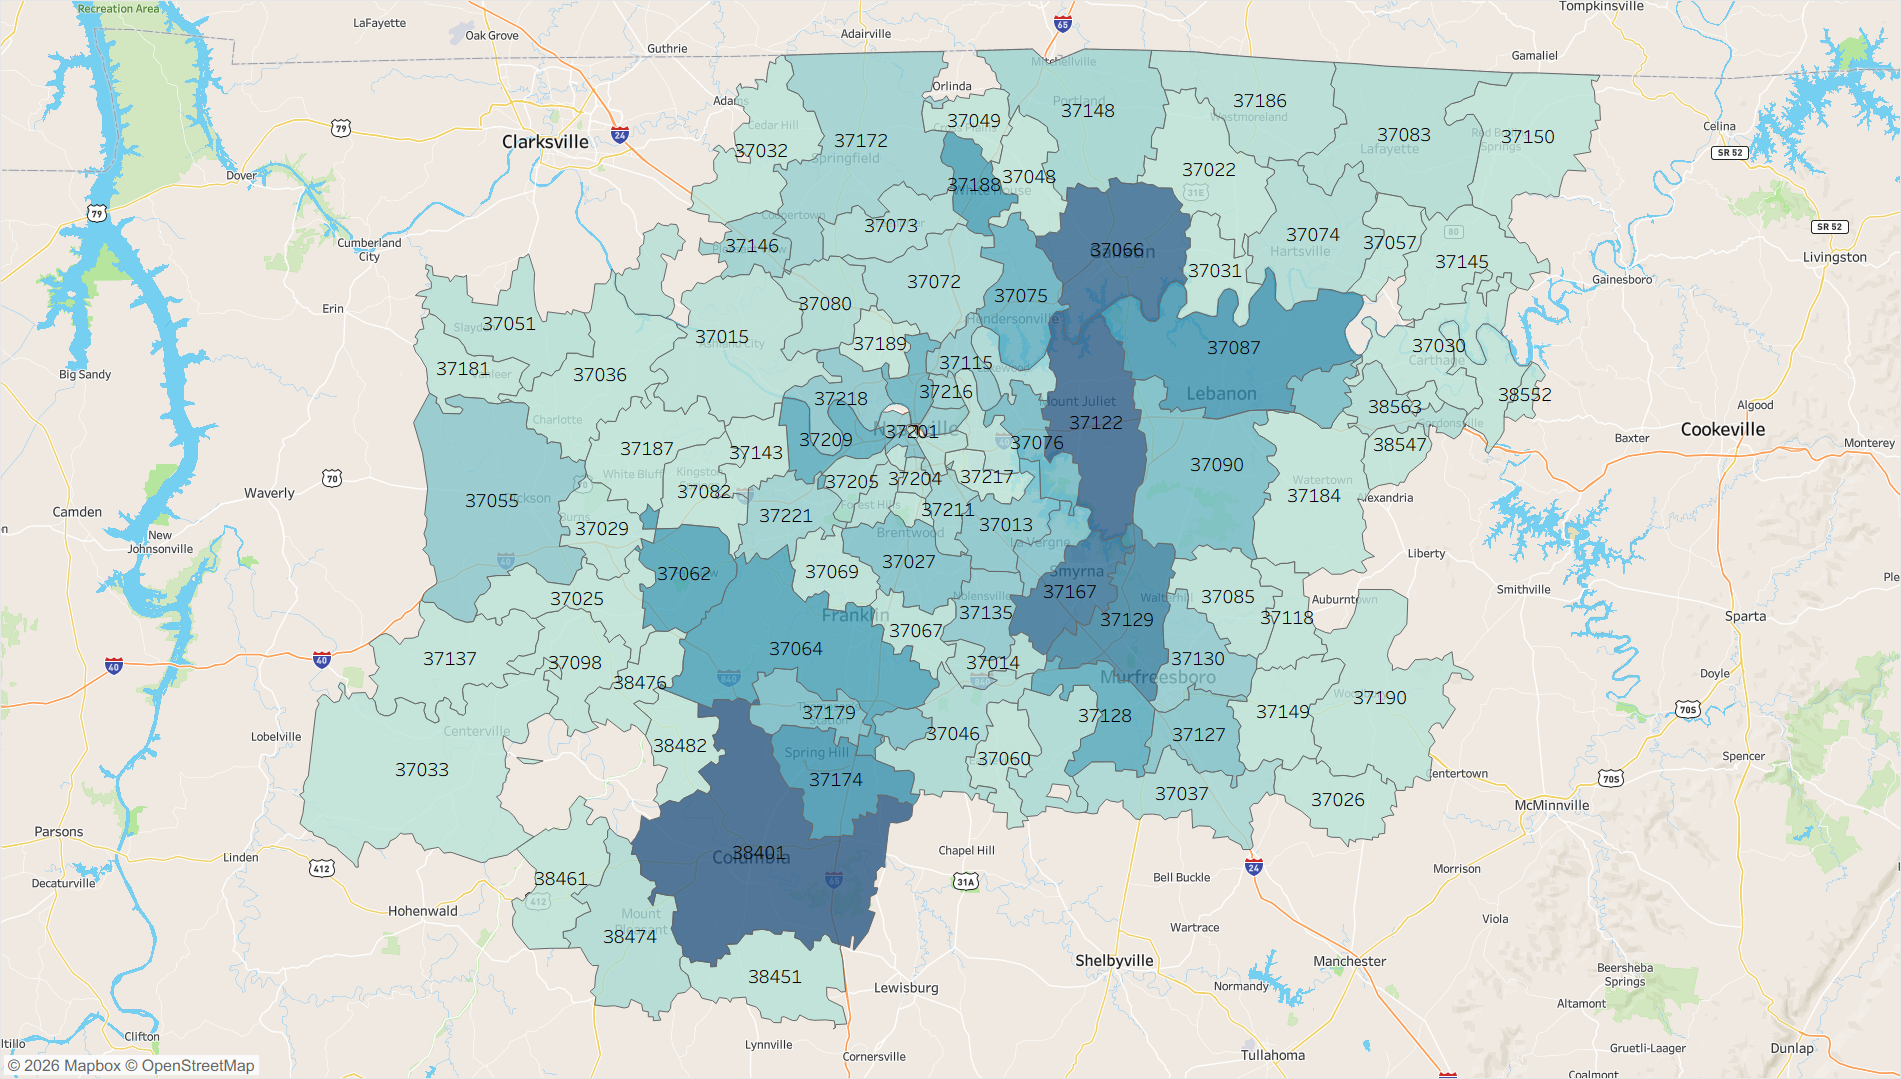
Nashville new construction is concentrated in the suburbs rather than in Music City proper, with zips like 37066 (Gallatin), 37122 (Mount Juliet), and 3840 (Columbia) leading the way. Nashville is held back in our rankings by a middling sustainability score. New builds in the metro tend to have higher flood and fire risks than existing homes for sale there.
Chattanooga, TN-GA
Inventory Score: 77.8
Price Score: 70.7
Sustainability Score: 92.9
Hotness Score: 69.7
Total Score: 76.6
Keeping our focus on the Volunteer State, number six in the top metros for new construction is the Chattanooga metro. Chattanooga is a manufacturing and automotive hub where strong middle-class job opportunities lead to demand for newly-built homes. 26.8% of the listings for sale in Chattanooga are new builds, and the median price of these new homes is competitive with the existing homes for sale there ($425,080 vs $386,163). Chattanooga has a top-tier sustainability score due to the new builds experiencing significantly lower flood risk than existing homes for sale in the metro.
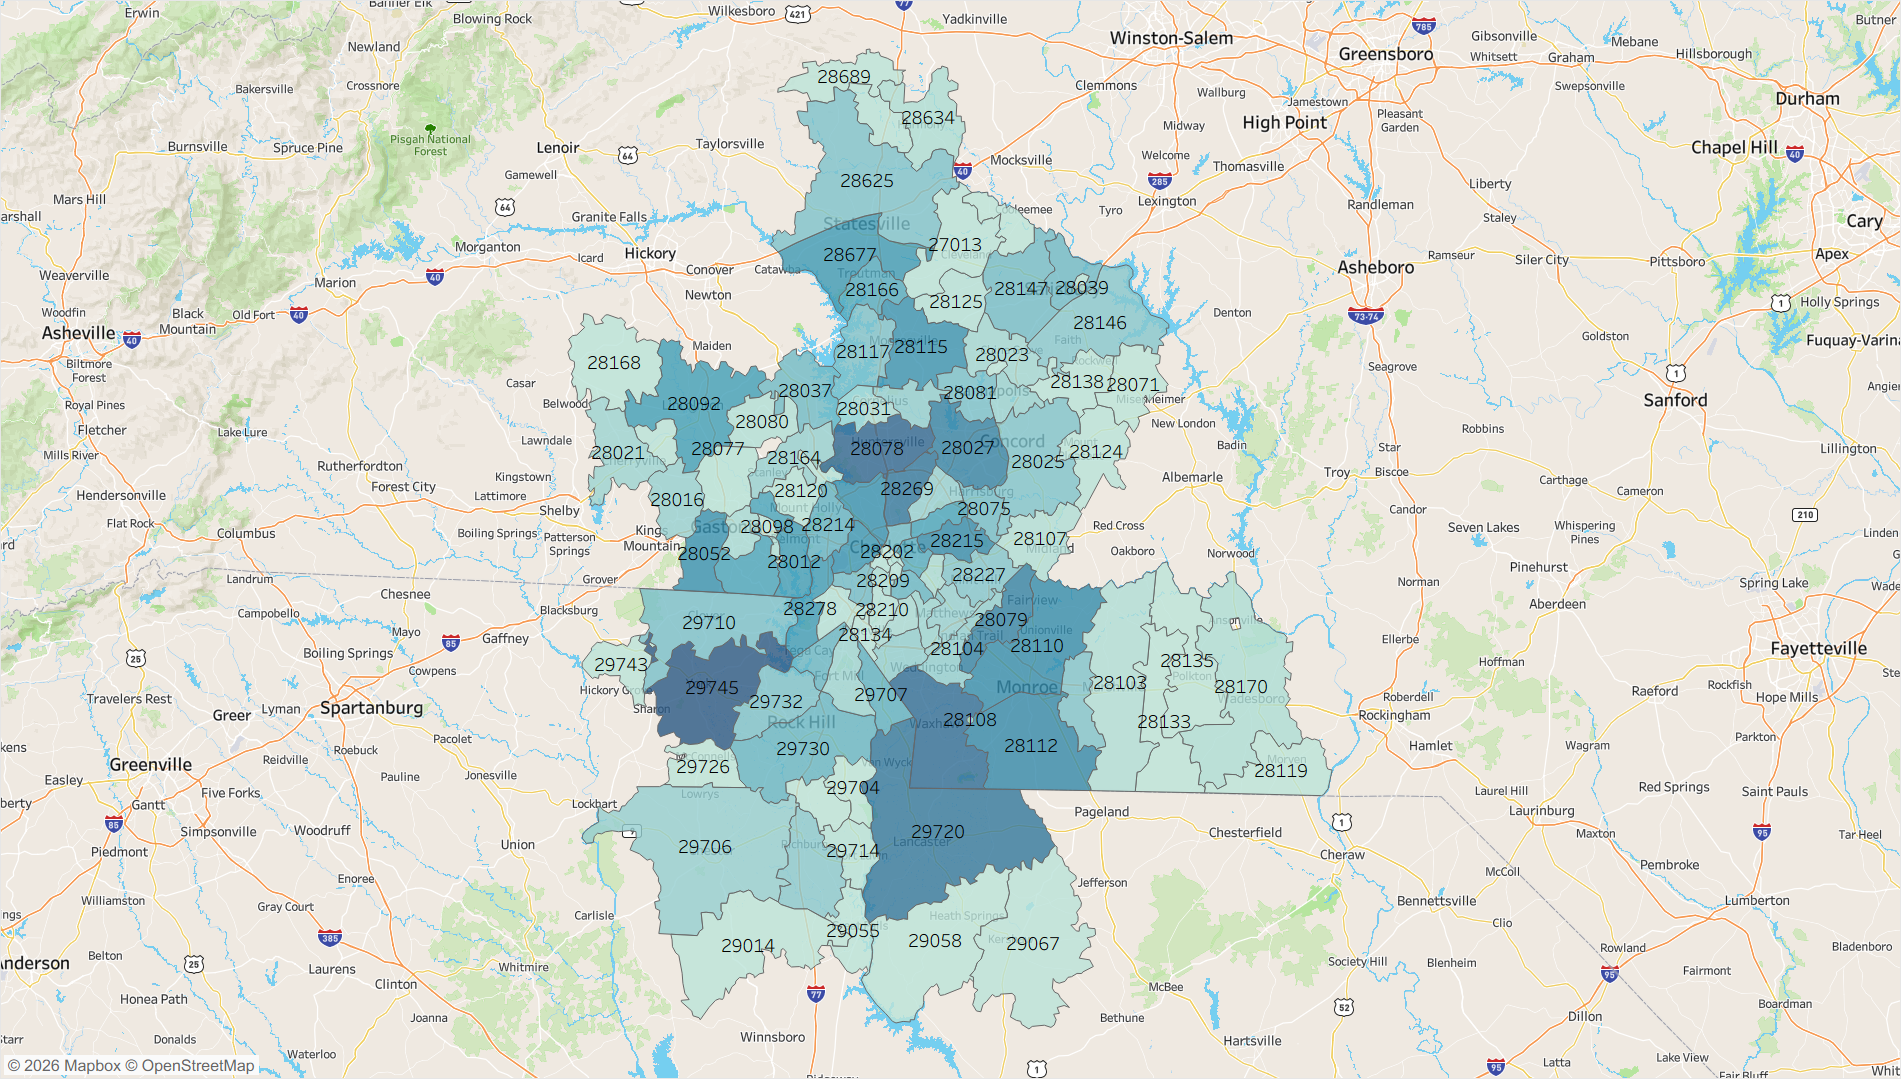
Chattanooga new construction is highly concentrated in the eastern suburbs of the metropolitan area. Zip code 37363 (Ooltewah) contains the most new builds for sale in the Chattanooga area and is in close proximity to the Volkswagen plant. The new construction price premium, while low on a national scale, is higher in Chattanooga than in many of our other featured metros, leading to a lower pricing score, and market hotness for Chattanooga new construction is a bit on the low side as well. This stems from new construction listings spending longer on the market and receiving fewer page views.
Winston-Salem, NC
Inventory Score: 91.9
Price Score: 72.7
Sustainability Score: 56.6
Hotness Score: 74.7
Total Score: 76.6
The Winston-Salem, NC metro comes in at number seven in our ranking due its high availability of new construction listings. 33.0% of the homes for sale in Winston-Salem are new builds, and those homes have a median price of $353,564 compared to $322,358 for existing homes (a 9.7% premium). Winston-Salem is home to a number of healthcare and biotechnology employers whose workers drive the demand for new homes in the metro, resulting in a hotness score that is stronger than the other North Carolina metros featured here.
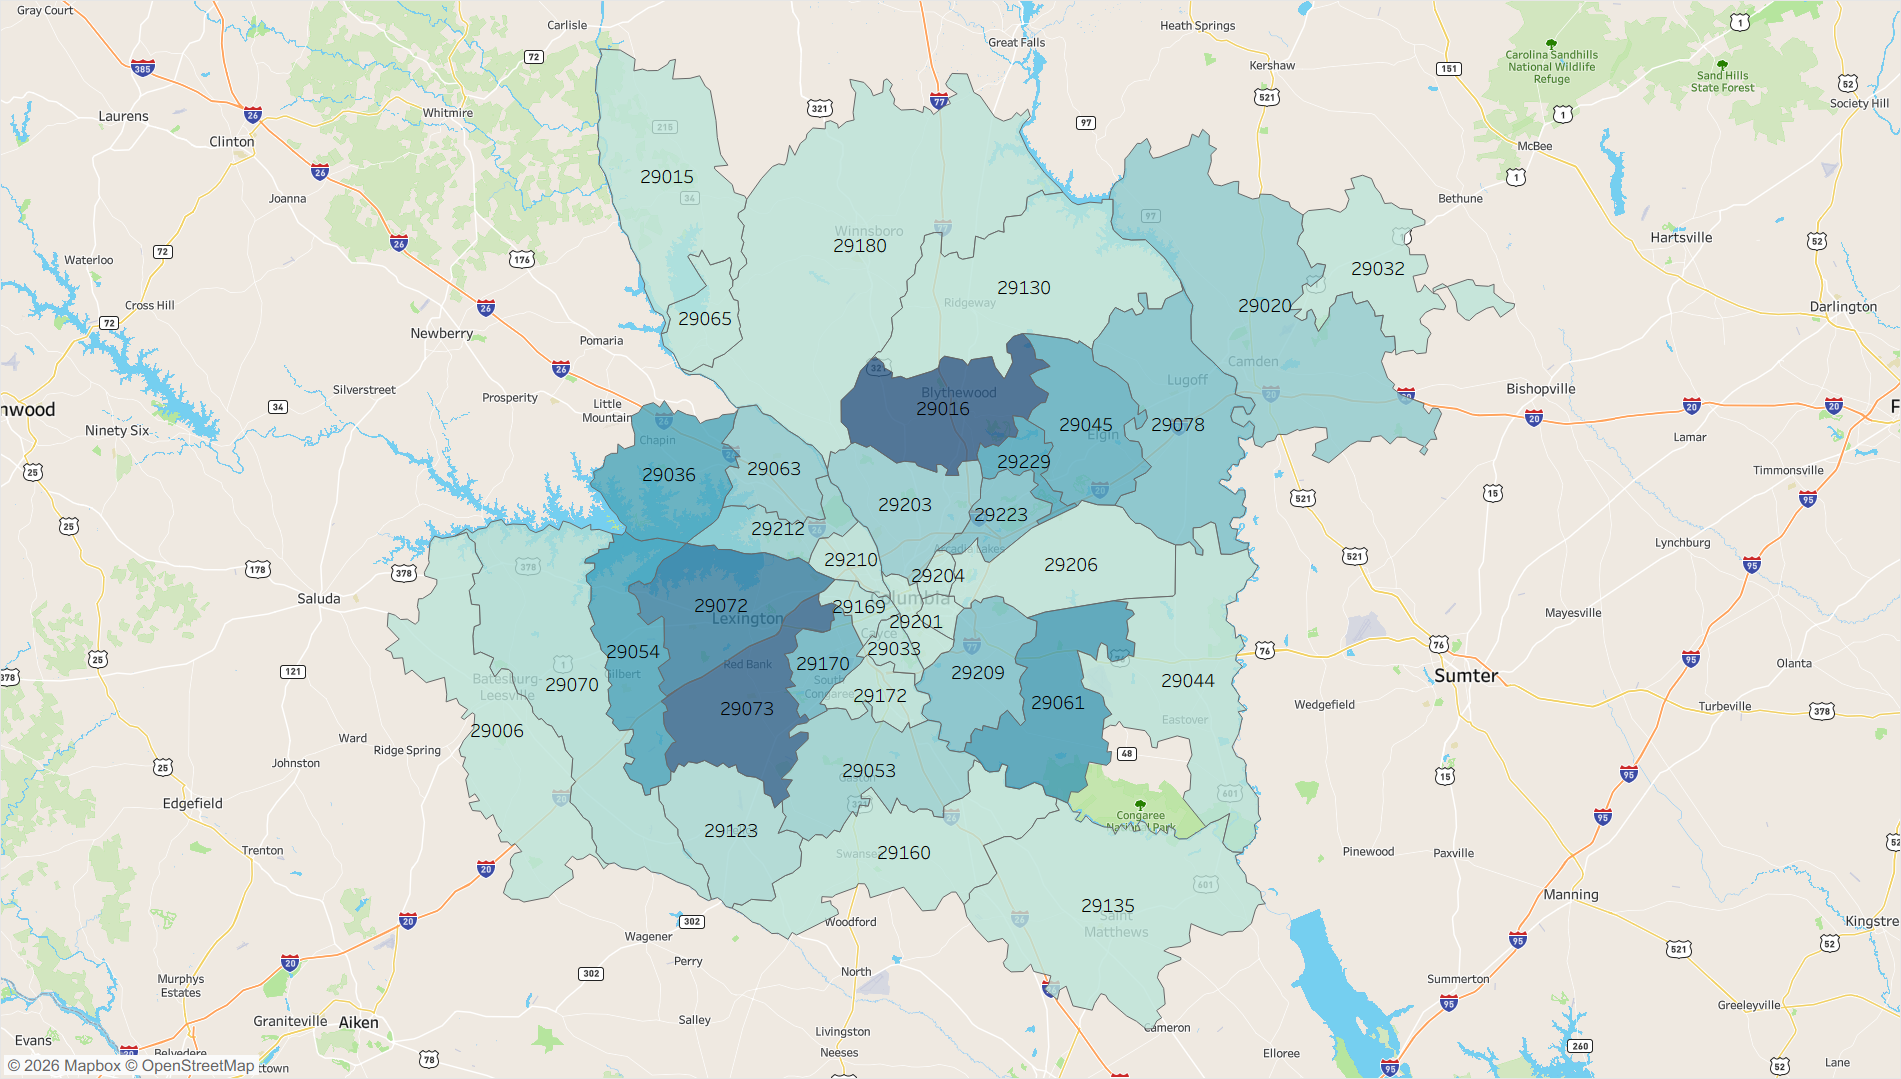
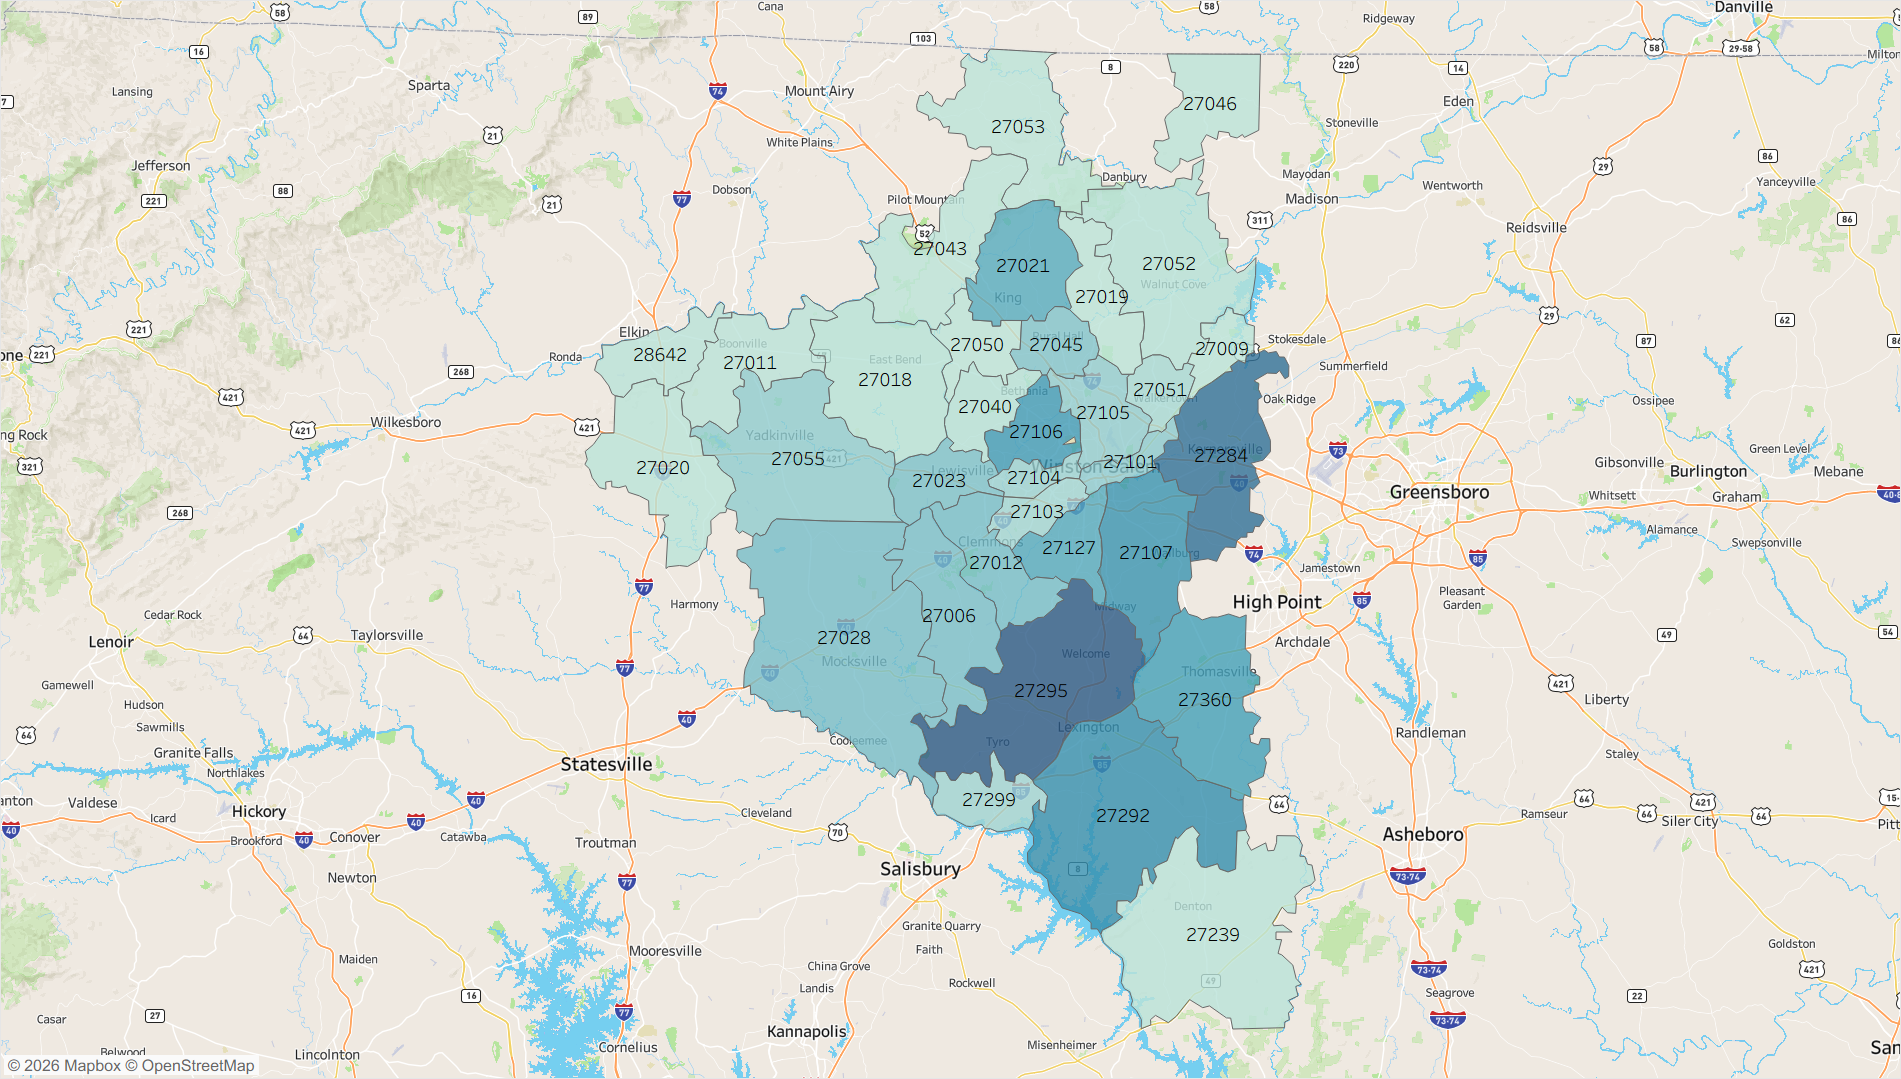
New homes in Winston-Salem can be found near the city proper, but also in neighboring towns to the south like Lexington (27295) and to the east like Kernersville (27284). The weakest score for Winston-Salem in our metrics is the sustainability score. This is due to the fact that new builds for sale in the metro tend to have higher risks of flooding and wildfires than the existing homes on the market there.
Madison, WI
Inventory Score: 86.9
Price Score: 65.7
Sustainability Score: 72.7
Hotness Score: 80.8
Total Score: 76.5
The only Midwestern market featured in our top ten, Madison, WI offers a robust supply of new construction listings in a market that needs them. Many Midwest markets are experiencing tight supply, as existing home inventory has not yet recovered from the pandemic shock and there is little new construction activity to speak of. Madison keeps the hotness of its fellow Midwest markets, but instead has a high percentage of listings that are newly built: 30.8%. The economy of the state capital produces steady demand for homes, and new builds in Madison get the most page views per listing of any of our featured metros.
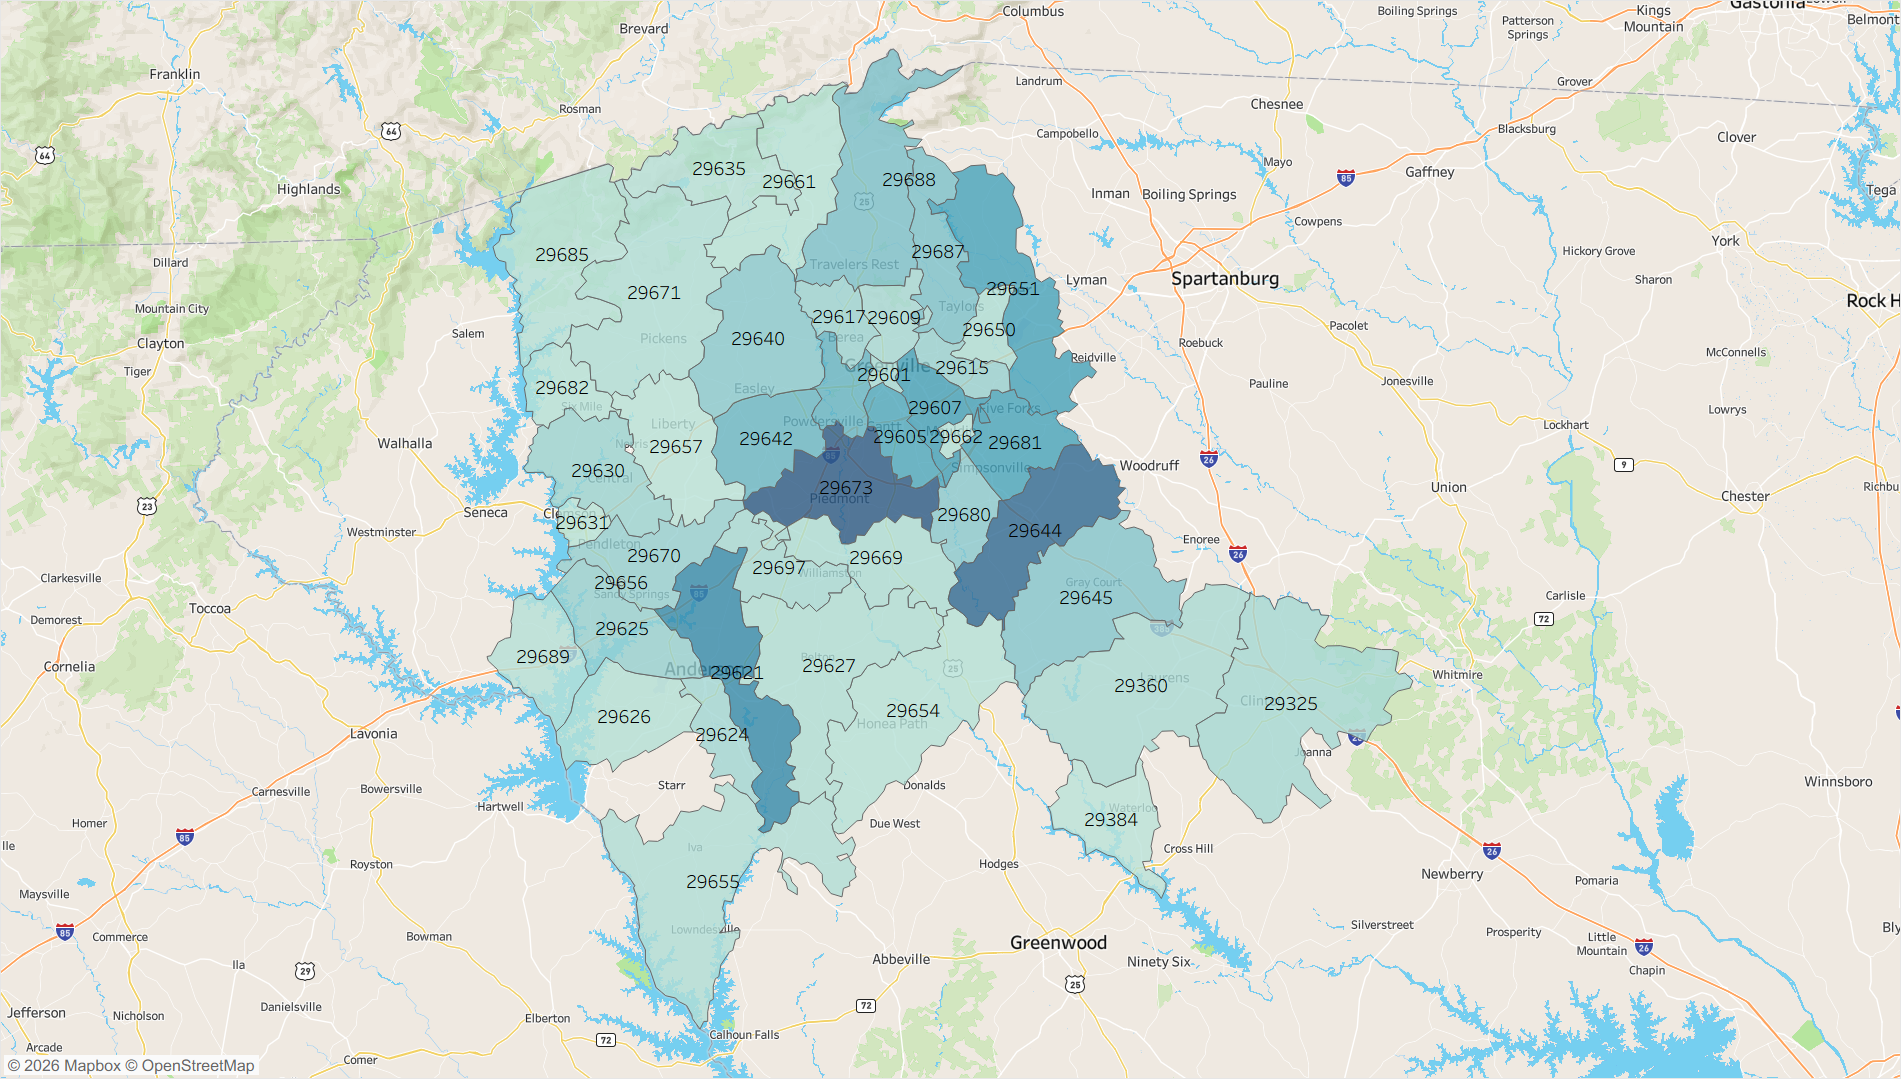
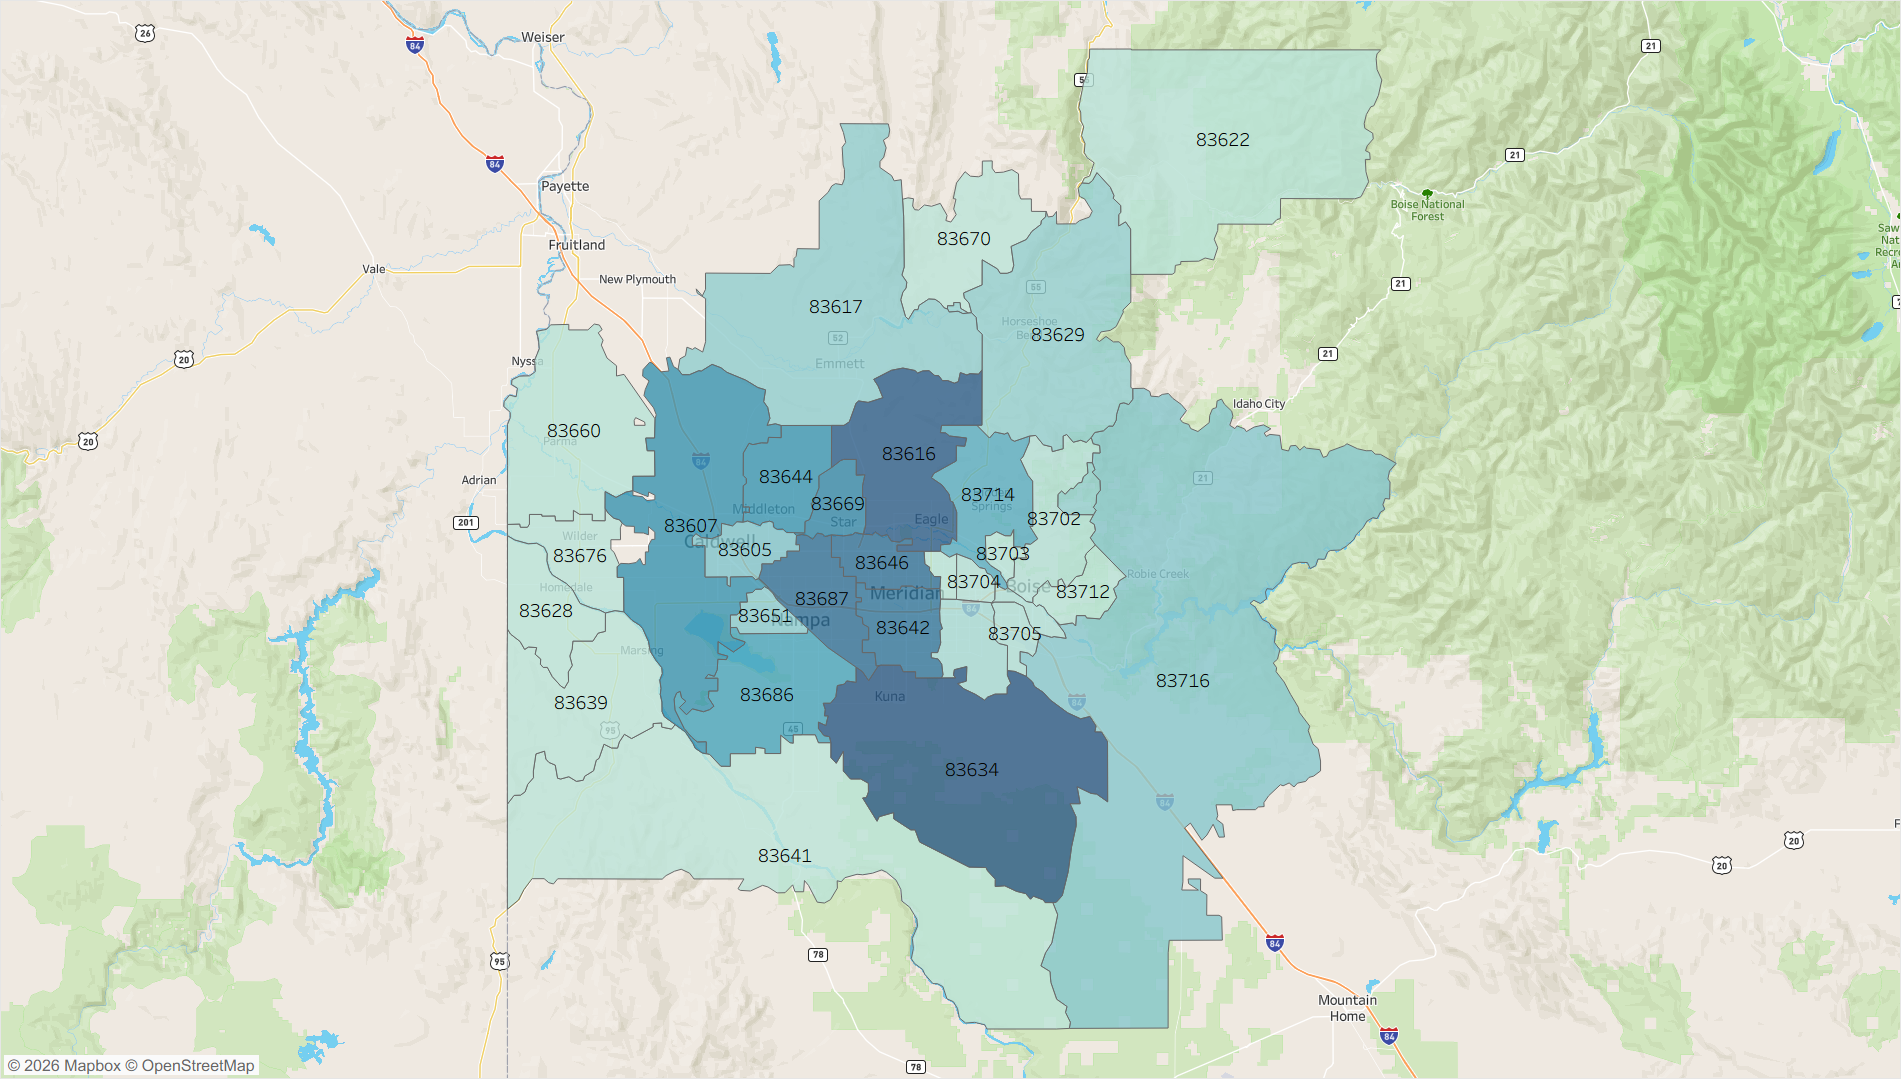
New construction activity forms a close ring around Madison, offering easy commutes to the city center. Some zip codes noteworthy for their high share of the new construction listings in the metro include 53562 (Middleton) and 53597 (Waunakee). The drawback in Madison is that new homes are more expensive than existing homes by a larger margin than in many of the other metros featured. The median price of a new build is $521,304 compared to $463,225 for an existing home. This 12.5% new construction premium is far lower than in most other metros in the Midwest, but it fails to compete with many Southern metros.
Durham-Chapel Hill, NC
Inventory Score: 90.9
Price Score: 75.8
Sustainability Score: 79.8
Hotness Score: 41.4
Total Score: 75.6
Durham, NC comes in at number nine on our list of the top metros for new construction, boasting a large share of new construction listings for sale that rank it in the top ten percent of metropolitan areas studied. 33.0% of homes on the market in the Durham metro are new builds, and they are priced somewhat competitively with the existing homes there with a median of $489,282 compared to $450,179. The Research Triangle is home to lucrative careers in tech and medicine that are driving the growth of the Durham metro.
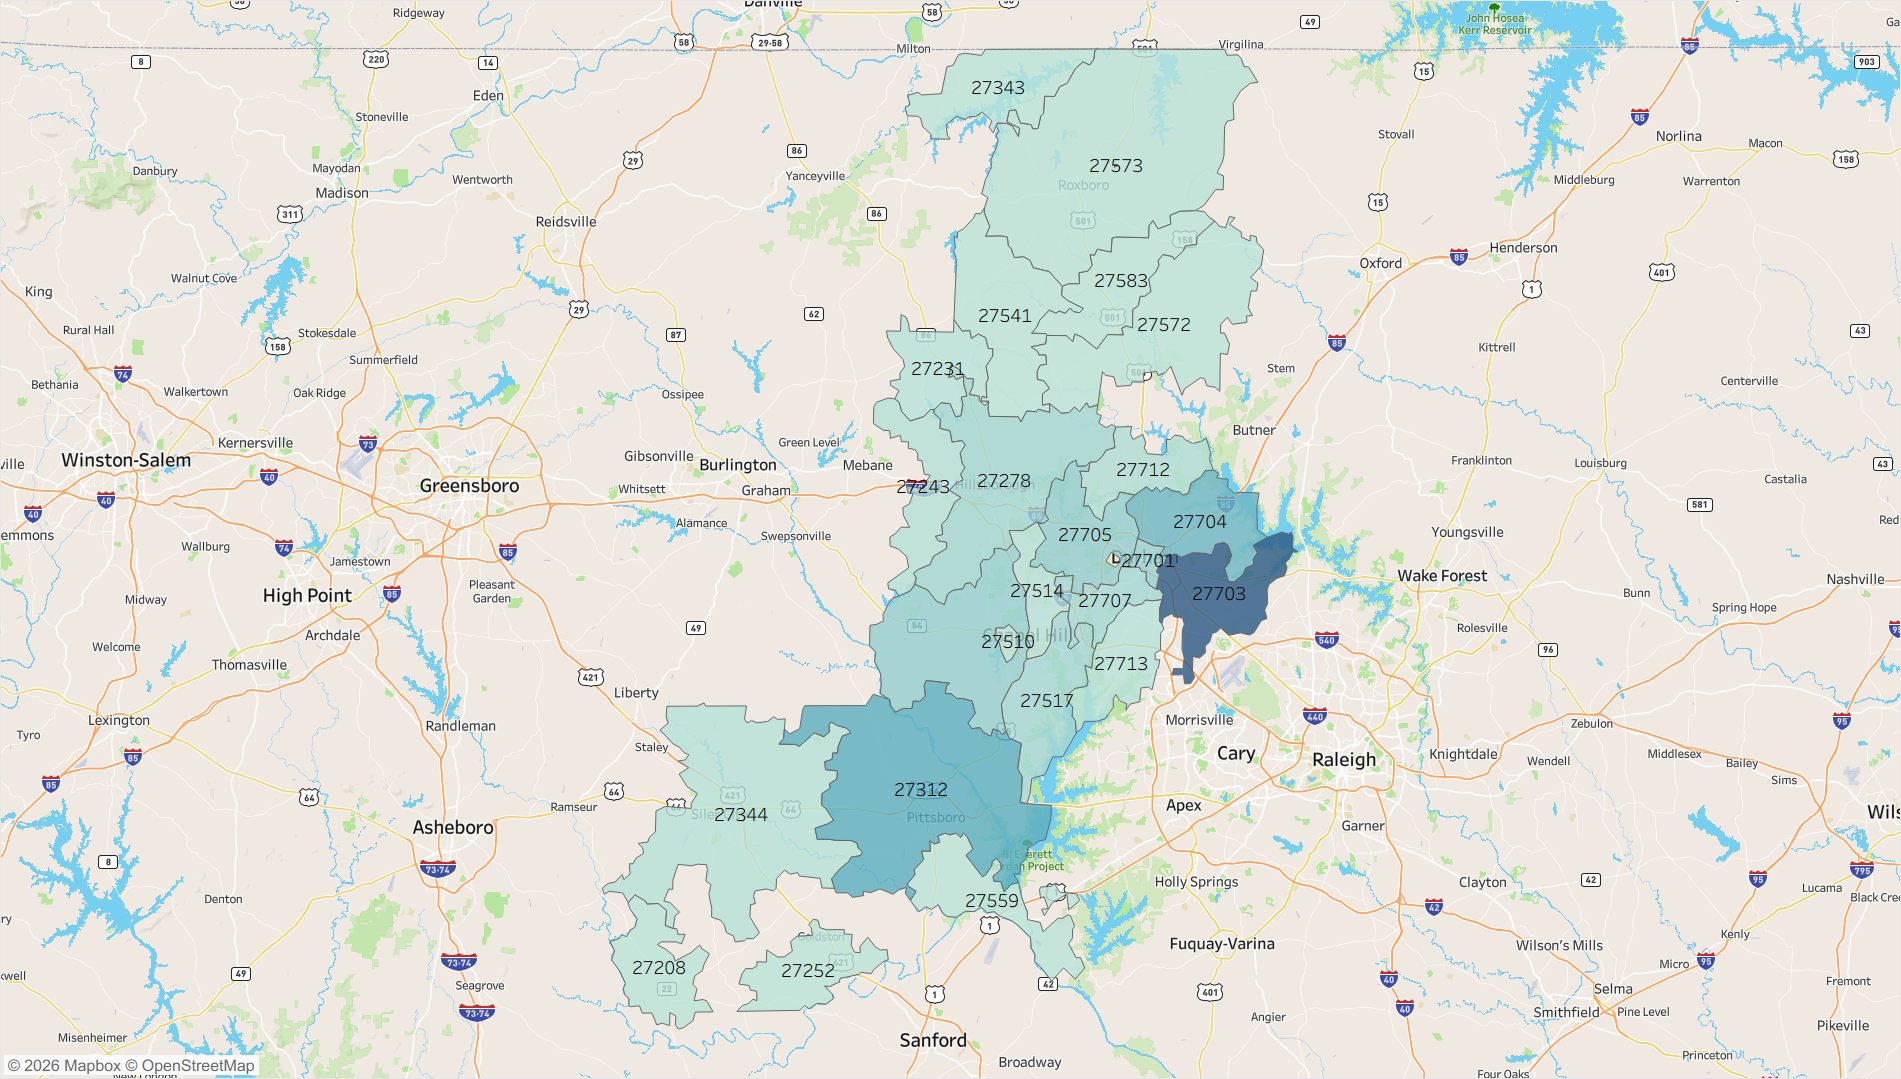
The zip codes that are home to the most new home listings are 27703 in southeast Durham and 27312 in Pittsboro, both of which border the nearby-Raleigh-Cary metro area, showing that Durham metro new home buyers have options both in the city proper and in small towns nearby. Durham is held back in our rankings by its hotness score, as its new home listings get relatively few page views and spend longer on the market compared to existing homes in the metro.
Columbia, SC
Inventory Score: 72.7
Price Score: 94.9
Sustainability Score: 31.3
Hotness Score: 87.9
Total Score: 75.6
Coastal and Upstate South Carolina were featured in the top two spots of our list, and now Central South Carolina claims the final spot. Columbia, SC is home to a strong, if relatively low share of new construction listings on the market at 25.5%. Where Columbia really shines is in new construction pricing. The median new build is priced at $298,004 compared to $307,158 for existing homes, making Columbia the most affordable metro on the list. Like other metros featured, serving as the seat of state government leads to steady employment in the metro and subsequent strong demand for new homes. Market hotness is a strength in Columbia.
Columbia’s new builds tend to be located to the north and west of the city center, in zips like 29016 (Blythewood) and 29073 (Lexington). Columbia’s biggest weakness in our metrics is its sustainability score. New builds in the metro tend to be at a higher risk of wildfire than the existing homes for sale there.
Honorable Mentions
| Metro | New Construction Share of Listings | New Construction Premium | Climate Risk Score vs Existing Homes | Page Views per Listing vs National Average | New Construction Days on Market |
|---|---|---|---|---|---|
| Richmond, VA | 35.7% | 20.7% | -1.5% | 5.4% | 65 |
| Raleigh-Cary, NC | 41.9% | 1.8% | 5.1% | -19.1% | 69 |
| Cape Coral-Fort Myers, FL | 20.1% | -12.9% | -0.6% | -2.4% | 75 |
| San Antonio-New Braunfels, TX | 34.0% | 2.9% | 8.2% | -57.2% | 59 |
| Spokane-Spokane Valley, WA | 18.5% | 4.3% | 1.7% | -4.5% | 53 |
| Austin-Round Rock-San Marcos, TX | 32.8% | -8.1% | 6.7% | -48.1% | 71 |
| Augusta-Richmond County, GA-SC | 32.6% | 3.9% | 4.5% | -40.0% | 82 |
| McAllen-Edinburg-Mission, TX | 24.0% | 3.4% | 4.9% | -24.8% | 67 |
| Greensboro-High Point, NC | 28.6% | 19.7% | 3.9% | 12.8% | 70 |
| Houston-Pasadena-The Woodlands, TX | 28.6% | 9.3% | 6.6% | -68.4% | 59 |
| Wichita, KS | 29.6% | 8.1% | 8.5% | 47.6% | 89 |
| Dallas-Fort Worth-Arlington, TX | 31.0% | 9.8% | 13.6% | -9.5% | 68 |
| Lakeland-Winter Haven, FL | 26.8% | -1.4% | 6.7% | -29.0% | 77 |
| Knoxville, TN | 18.9% | 16.7% | 1.5% | 87.9% | 69 |
| Portland-South Portland, ME | 14.4% | 15.2% | -2.1% | 359.5% | 64 |
Methodology
Listing data is collected from listings on Realtor.com between Jan. 1 and June 30, 2026. All scores are based on a percentile rank of each metric calculated for each of the 100 largest metros by household count. New-construction share of listings is the number of listings in each metropolitan area designated as new construction divided by the total number of listings in that metro. New-construction premium is the percentage difference between the average of the monthly median listing price for new construction and existing homes. Climate risk data comes from First Street for flood, fire, air, wind, and heat risks. The percentage difference between average new-construction and average existing-home risk scores is calculated for each risk type, and the average of these differences produces a risk differential that is then scored on a percentage rank basis. Market hotness is an average between the percentage rank scores of page views per listing on Realtor.com (total page views for new-construction listings divided by the number of new-construction listings) and the percentage rank of time on the market for new-construction listings.